After attending the Sacramento Mountain Spectroscopy Workshop last year and getting excited about doing spectroscopy on my own telescope, I’ve been looking at various spectrometers for quite a while but they are quite a ways down the list on budget priorities so the costs have been prohibitive.
The cheapest entry point for spectroscopy for amateurs is the Star Analyser 100[1] (SA-100,) sold under a few brand names but manufactured in the UK by Paton Hawksley Education Limited. At about $200CDN to purchase not an inconsiderable expenditure, especially when you consider it’s essentially a plastic or glass diffraction grating mounted in a standard filter housing, how hard would it be to make one? Optimally we want the filter to be within standard size tolerances to facilitate putting it in a filter wheel with the normal LRGB or photometric BVRI filters.

Figure 1 – Paton Hawksley SA100
Given it’s name (and the SA200 also sold by the same manufacturer) the SA100 diffraction grating is clearly 100 lines/mm, while the SA200 is 200 lines/mm which provides a larger image for larger sensors or where the sensor is closer to the grating such as in filter wheels where the camera is attached via threads to the wheel. Where the filter is attached to the nosepiece of the camera, a 100 lines/mm grating is quite sufficient. This was confirmed on the https://www.rspec-astro.com/calculator/ site, which is useful to see what will work with your telescope setup.
With the confident assurance that a 100 li/mm grating would work, I went looking for one, eventually ending up on AliExpress and a “Ultra Precision Nano Engraving PET Trasmission Diffraction Grating F Teaching spectral decomposition Precision component Detect.” This is a 36mmx28mm grating which can be mounted in an old color filter (after being cut down a bit to fit 1.25” or 31.75mm) at a wallet friendly $10 each. I bought a few of them in case I wrecked them cutting them down. Unfortunately the shipping time was quoted at 57 days so I had a long wait to see what actually arrived. On to other projects!
The slow boat from China finally arrived after a fairly decent 25 days and I could get on with this project! At first I thought someone in China had shipped my a lot of tiny empty plastic bags til I realized each little bag held a diffraction grating. I grabbed an old Moon filter with a kind of crappy plastic case, unscrewed the retaining ring that keeps the filter in place, then used the old filter as a guild to cut the edges off the diffraction grating. I dropped the grating into the case, screwed it together, and viola!

Figure 2 – Dismantled filter w/grating, and final result
To mount the grating on my Canon 1100D (Digital Rebel 3T) 12.2 mp DSLR, I had planned to use a T ring and a nosepiece that screwed into it. I know the sensor to T-ring is about 44mm and the distance from the ring to where the filter will screw in is an additional 50mm so 90mm is the distance from sensor to the grating will be about 94mm. The pixel size for the camera is 5.9u x 5.9u so plugging these numbers into the RSPEC site linked about indicated I should be able to get a reasonable dispersion of 6.3 angstroms (Å) per pixel for a spectral coverage of 0 to 12,854 Å – visible light covers 4100Å in the violet to 7000Å in the red so this is ample for our purposes.
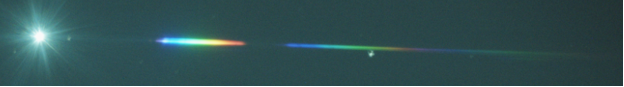
First light on the grating produced the following image of Vega through the PMSA mounted on my Celestron C8 with aperture of 203.2 and focal length of 2032mm (F10.)

As you can see, over to the left is the image of Vega itself (referred to as the 0th order image) while the 1st order spectrum is closer to the middle of the frame. You can also see there’s a 2nd order spectrum which is much fainter than the first. We’re interested in analyzing the first order spectrum, of course. You can see from the spectrum there are absorption lines visible. The only downside of this setup currently is I’d like to get the grating closer to the sensor to get a wider spectrum so I can spread less Å per pixel.
So what now? I need some software to process the image into something I can compare to a reference image to see how I did with Vega. RSPEC (https://www.rspec-astro.com) from Field Tested Systems, LLC. is pretty much the best software out there for use with the Star Analyser but at $109US it’s not cheap. Alternatives are the free Visual Spec by Valerie Desnoux (http://www.astrosurf.com/vdesnoux) and ISIS by Christian Buil (http://www.astrosurf.com/buil/isis/isis_en.htm.) ISIS is as difficult to use as it is powerful, and VSPEC was rather fussy about file formats so I ended up installing a 30 day trial of RSPEC to see how it works. Here’s my result on Vega:

Compared to a spectrum from Robert J. Vanderbei at Princeton taken with a SA and processed with VPSEC ( https://vanderbei.princeton.edu/images/NJP/spectra.html) there’s some issues with my version, problably related to focus and potentially the IR cut filter in the camera (since the red dips dramatically but I see that there’s hints of the H δ, H γ, and H β lines that appear in much the right spots, so I think the grating is doing it’s thing.

Stay tuned for some further articles about my experiments in Spectroscopy – I’ve ordered a ADT2 adapter from Field Tested Systems that screws into my camera’s t-ring and allows the grating to be about 44mm away from the sensor, which should give me better resolution and focus.
In the meantime, if you have any questions please feel free to contact me on Facebook. See you there!
[1] For excellent info on this spectrograph see http://translate.google.com/translate?hl=en&sl=auto&tl=en&u=http%3A%2F%2Fastrosurf.com%2Fbuil%2Fstaranalyser%2Fobs.htm